New Cyrus “NextGen” antibody software outperforms the competition in third party test with BIOCAD biotechnology
Cyrus has developed a “NextGen” antibody structure prediction tool (NextGen) based on the RosettaCM “hybridize” algorithm (1). Cyrus customized and modified RosettaCM for antibody structures with an antibody-specific database, sequence parsing, and by taking antibody-specific heavy-light chain orientation into account.
NextGen was developed and benchmarked on the test set of antibody structures from the AMA-II (2). In those tests, the NextGen tool produced more accurate models (measured by RMSD metrics) for the AMA-II antibodies, compared with all other entrants in AMA-II, including Schrödinger, CCG and older Rosetta algorithms.
To independently validate these results we worked with BIOCAD (https://biocadglobal.com) on a 26-protein test set to compare Cyrus NextGen antibody structure prediction with Schrödinger and another major vendor software. Tests were performed as follows:
- BIOCAD scientists ran predictions using all non-Cyrus software
- Cyrus scientists produced models by running NextGen
- BIOCAD scientists calculated the metrics described below on the models produced by Cyrus and other software
Cyrus NextGen was the most accurate antibody modeling tool across all of the tested methods in this independent test (Figure 1).
A sample structure overlay of a crystal structure and a NextGen antibody model is shown in Figure 2.
Cyrus is releasing these results here directly for rapid dissemination and will release a more detailed white paper describing the methods and results once that manuscript is ready.
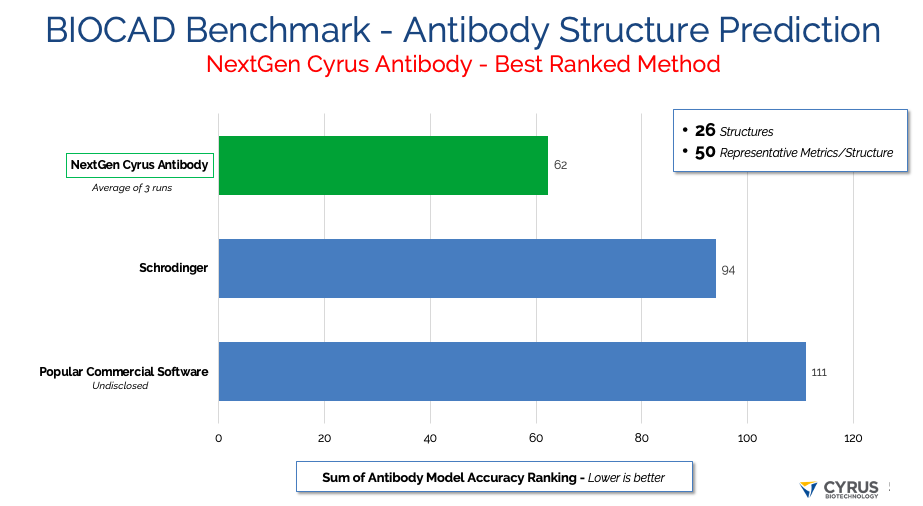
Figure 1. Antibody model accuracy over the BIOCAD set of 26 antibody-Fv structures using the sum of metrics described here in “BIOCAD structure similarity metrics” — lower is more accurate.

Figure 2. Example structure prediction using NextGen antibody, with Cyan = Crystal Structure. Light Brown = NextGen predicted structure (PDB 4M61)
BIOCAD Dataset
The BIOCAD antibody data set consists of 26 recently-released structures of bound and unbound antibody structures (Fv domains consisting of heavy (VH) and light (VL) chains), which Cyrus did not use as templates for NextGen structure prediction.
BIOCAD structure similarity metrics
BIOCAD calculated the structural variation of predicted models for each VH-VL antibody complex in comparison to the crystal structures in order to compare model quality of the top-performing algorithms. Combined, there are 50 parameters for each structure which fall into 10 categories.
- RMSD of all Ca per chain when aligned by chain
The first type of metric calculates the Root Mean Square Deviation (RMSD) between alpha Carbons (Ca) of the experimental and predicted structures when aligned by chain. (2 parameters per structure).
- RMSD of CDR N-Ca-C when aligned by chain
The second metric calculates the RMSD between the backbone atoms (Nitrogen, Ca, and Carbonyl Carbon aka N-Ca-C) in the CDR residues of the experimental and predicted structures when aligned by chain. (6 parameters per structure).
- RMSD of CDR Heavy Atoms when aligned by chain
The third metric calculates the RMSD between the Heavy Atoms CDR residues of the experimental and predicted structures when aligned by chain. (6 parameters per structure).
- RMSD of CDR N-Ca-C when aligned by CDR
This metric calculates the RMSD between the Na-Ca-C in the CDR residues of the experimental and predicted structures when aligned by each CDR. (6 parameters per structure)
- RMSD of CDR Heavy Atoms when aligned by CDR
The third metric calculates the RMSD between the Heavy Atoms in the CDR residues of the experimental and predicted structures when aligned by each CDR. (6 parameters per structure).
- Difference between the Stem Length for each loop
For each loop, the distance is calculated between the Ca of the two Framework (Fr) residues before and after the loop. (6 parameters per structure).
- Alpha and Tau Angles per CDR
For each loop, the Alpha Angle is calculated by measuring the flat angle created by the last 3 Ca in the CDR. The Tau Angle is calculated by measuring the dihedral angle created by the last 3 Ca in the CDR and the next Fr Ca. (12 parameters per structure).
- Distance between the pivot for VH and VL
Four non-atomic positions are defined by Marze et al (3) which characterize the orientation between the Heavy and Light chains. Positions 2 and 3 are the pivot points for the Heavy and Light chains. This distance is calculated once for the structure (c in figure 3). (1 parameter per structure).
- Two flat and one dihedral Angle for the Marze positions
For the four positions defined by Marze et al, there are two flat angles between positions 1, 2, and 3 and between positions 2, 3, and 4 and the dihedral for all 4 positions. These were calculated once per structure (a, d, and e in Figure 3). (3 parameters per structure).

Figure 3. From Marze et al (3), a) orientation between the heavy and light chain is calculated by establishing 4 positions at conserved spots with respect to 4 framework sheets. b) The Packing angle, c) Interdomain distance, d) light Opening Angle, and the heavy Opening Angle are calculated as shown based on these 4 points.
- Principal Component Analysis (PCA) Angles
Dunbar et al (4) described a PCA protocol for calculating the orientation between Heavy and Light chains. Two of those flat angles, Tilt and Twist, are calculated following that method. (2 parameters per structure).
Scoring and Ranking
Starting from these 50 parameters, BIOCAD ran PCA to determine the correlation among parameters. They found that 99% of the variance can be retained without 34 of the 50 parameters. As a result, BIOCAD defined 16 parameters and calculated a linear combination of the original 50 parameters. The weights for the linear combinations are the first 16 eigenvectors of the covariance matrix.
The resulting difference score is the euclidean norm of the final 16 components. If the compared structures are the same, the sum is equal to zero. The more the structures differ, the larger the sum becomes. A perfect prediction algorithm would score 0 in this sum metric, but of course even crystal structures of the same protein under different conditions differ slightly, so a 0 score is not possible.
Scores are then used to rank each antibody from each group/algorithm/method. The sum of the ranks provides an overall performance ranking per group of all 26 antibodies in the BIOCAD dataset. A lower overall summed score indicates better predictive performance for each group/algorithm.
References
- High-Resolution Comparative Modeling with RosettaCM. Song Y, DiMaio F, Yu-Ruei Wang R, Kim D, Miles C, Brunette TJ, Thompson J, Baker D. Structure. 2013 Oct;21(10):1735-1742
https://www.sciencedirect.com/science/article/pii/S0969212613002979
- Second Antibody Modeling Assessment (AMA-II). Almagro JC, Teplyakov A, J Luo, RW Sweet, S Kodangattil, F Hernandez-Guzman, G. Gilliland. Proteins. 2014 Aug;82(8): 1552-1562.
https://onlinelibrary.wiley.com/doi/abs/10.1002/prot.24567
- Improved prediction of antibody VL-VH orientation. Marze NA, Lyskov S, Gray JJ. Protein Eng Des Sel. 2016 Oct;29(10):409-418.
https://www.ncbi.nlm.nih.gov/pmc/articles/PMC5036862/ - ABangle: characterising the VH-VL orientation in antibodies. Dunbar J, Fuchs A, Shi J, Deane CM. Protein Eng Des Sel. 2013 Oct;26(10):611-20.
https://academic.oup.com/peds/article/26/10/611/1509255
Attachments